

As anyone working in the shipping industry will attest to, bunker (or fuel) is one of the biggest expense items for any container shipping company.
According to most estimates, bunker costs comprise circa 50% to 60% of a carrier’s total operating expense, thus making it by far the largest component of the carrier’s variable cost base.
Bunker prices consequently exert an inordinately higher influence on any shipping company’s cash flows and have the potential to make or mar its fortunes.
Matters are aggravated by the inherent volatility in bunker prices, which show violent fluctuations consequent to global geo-political tensions and are dependent on the actions of a cartel of oil-producing nations. These fluctuations in price make it difficult to estimate expenses and budget for forthcoming periods or set freight rates to reflect costs to a reasonable degree.


Apart from this, bunker, though proportionately tied to business volumes/ containers transported, is not a completely direct function thereof (as would be the case with Terminal Handling Charges, which are, in essence, the straightforward product of the THC quantum charged by the port/ terminal/ stevedore and the number of containers/ quantity of cargo handled), and is, therefore, an area where companies need to adopt a multi-pronged approach and resort to innovative strategies to reduce bunker consumption and overall bunker spend.
Over the past couple of decades, bunker prices have typically been on an upward trend, save a few years of global downturns and recessions, which meant that shipping companies were left staring at ever-increasing bunker spending, year after year.
As a consequence of the wafer-thin margins that the container shipping industry has historically experienced (prior to the super profits in 2021 and 2022 that can primarily be attributed to global supply chain disruptions, widespread port and quayside congestion, and Covid-induced lockdowns), as well as the cyclical nature of the industry, Carrier’s have focussed rigorously on reducing their cost base, with Bunker obviously being the prime area of attention, by virtue of it comprising over half of overall operating expenses.
It is for this reason that shipping companies are extremely particular about their bunker consumption and spending, expending considerable efforts to ensure optimisation of the bunker procurement process, as well as having in place a robust mechanism for monitoring and reducing consumption thereof.
In this article, we will explore the various tactics and methods adopted by shipping companies to reduce bunker consumption and overall bunker spending.
The concept of slow steaming essentially involves sailing the vessel at slower speeds to reduce bunker consumption. This is the most prevalent tactic used to regulate bunker consumption, as well as one of the most effective. Its effectiveness stems from the fact that the correlation between vessel sailing speed and bunker consumption is not a straight linear equation but rather a quadratic one, implying that as the vessel sails at slower speeds, the corresponding drag on the vessel decreases by an even greater magnitude.
In practical terms, this means that the quantity of bunker consumed decreases in greater proportion than decreases in speed, enabling commensurately higher savings through even a relatively slight reduction in sailing speed.
Studies conducted on the effectiveness of slow steaming have concluded that reducing speed from 27 knots to 18 knots reduces fuel consumption by as much as 59%.
Under slow steaming, a vessel that typically sails at an average speed of 20-24 knots will instead sail at a speed of around 18-20 knots.
A further extension of this tactic is super slow steaming, where the vessels sail at an even slower speed of below 18 knots.
A relatively sophisticated variant of this concept involves using slow steaming only in accordance with commercial considerations rather than being implemented as a standard policy.
Here, a vessel will sail at its normal speed on the head haul voyage (when it is laden with export containers from manufacturing-dominant hubs in Asia, bound for the major consumption centres and markets in Europe and North America, while on the backhaul leg (the return journey, when the vessel will carry a lower quantity of containers, most likely lower in value than was carried on the head-haul leg, or repatriate empty containers), the vessel will sail at a slower speed.
Slow steaming was first introduced in the mid-2000s when global trade and container shipping were experiencing a boom. With container volumes transported globally growing at a healthy rate, bunker prices too were rising sharply, resulting in carriers’ annual bunker bills increasing manifold.
Maersk Line was one of the pioneers, having introduced slow steaming on its major main haul trade routes, and the trend slowly caught on as other carriers, upon becoming cognisant of the potential cost savings, started to reduce sailing speeds to the point that it ultimately became a firmly entrenched industry practise.
The other advantage slow steaming offered was the absorption of excess shipping/ vessel capacity. With investments in bigger vessels and an increasing order book of new builds, the market was flush with shipping capacity, which soon outpaced the growth in demand. Utilisation rates plummeted, and carriers realised that they had more tonnage than could be gainfully deployed.
This challenge was partly offset by slow steaming, as with slow steaming, the voyage days increased, meaning that shipping companies had to deploy more vessels on the service/ trade lane to be able to offer weekly rotations and meet originally planned sailing schedules. Slow steaming thus offered the dual benefit of reduction in bunker expenses and also soaking up the surplus capacity.
An added benefit of slow steaming is that it is environment friendly, as the GHG emissions reduce significantly due to the lower quantity of bunker utilised.
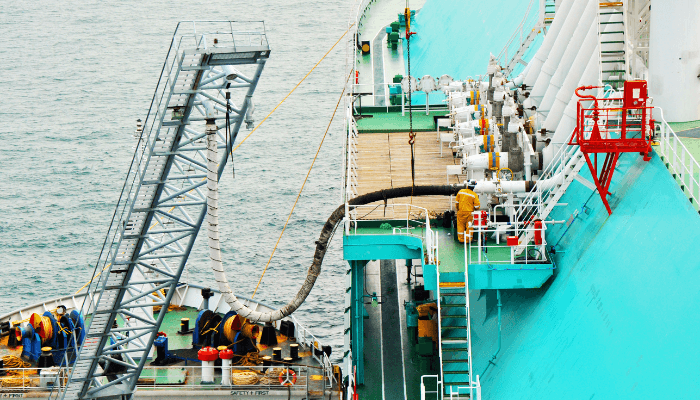

The choice of routing impacts the level of bunker consumption in far more ways than is obvious.
Whilst Carriers typically would prefer the shorter route when planning their service network and sailing schedules, the distance involved, though the most obvious factor, is not the only parameter that determines the vessel route. A host of other factors are evaluated while determining the route, such as climatic conditions, tidal forces etc.
This is so because in rough seas or in adverse weather conditions, vessels need to burn more bunker to sail. Likewise, if a vessel sails with the flow of the tidal currents, they consume lesser fuel as compared to if it had been sailing against the force of the tide.
Carriers, therefore, try to set or revise proforma sailing schedules and align routes with favourable sailing conditions. This also includes checking weather forecasts for inclement weather conditions and rerouting the vessel as necessary.
Apart from this, there are commercial and operational considerations at play as well.
Carriers try to optimise bunker consumption by striking the right balance between transit speed and bunker consumption. This is done by ensuring that the vessel takes the shortest route while carrying export cargo on the head haul, which needs to reach destination markets in time.
On the backhaul leg, however, where the cargo is typically not time sensitive or involves repositioning of empty containers, speed is not of the essence, wherefore Carriers sail at slower speeds.
Another example is when carrying high-value and time-sensitive reefer cargo, where the revenue, costs and risks render sailing at faster speeds a more desirable option.
Yet another example involves the threat of piracy. When sailing through pirate-infested waters, vessels sail at faster speeds, necessitating greater bunker consumption.
Once again, this decision is also influenced by prevailing bunker price levels. In a low bunker rate environment, the Carrier might decide that the cost of the additional bunker consumed is more than recompensed by the additional revenue from having ships and container turnaround faster (by sailing faster to complete the round trip rotation in fewer days and thus making more voyages).
Over the past few years, a plethora of technological solutions have been developed, which aim to help Carriers with inter alia planning their voyages, determining optimal speed, using AIS to forecast weather conditions, etc., all of which are then used to determine that routing option and schedule which involves the least amount of bunker consumption.
Driven by the growing complexity of international trade and transport, these tools are rapidly gaining in popularity, especially with the growing usage of LSFO (necessary to comply with the latest IMO regulations regarding GHG emissions).
Carriers increasingly realise that investment in software can yield significant benefits in the form of reduced bunker expenses.
The latest example of a leading global container carrier is that of CMA-CGM, which has signed a Memorandum of Understanding with PSA to use PSA’s Opt-E-Arrival tool. The tool is designed to reduce bunker consumption by enabling JIT at ports, which is expected to reduce the idle time that vessels generally spend awaiting berths. It is conjectured that this will result in a reduction of bunker costs between 4% to 7% for vessels calling in Singapore.
Especially useful in a high bunker cost environment, using scrubbers ensures a quick return on investment/ faster breakeven and has the added benefit of widening bunker procurement scope (in terms of a greater number of bunker suppliers and bunkering locations).
Carriers have seen a massive increase in their bunker spending post the implementation of stringent rules relating to GHG emissions. The new regulations impose a cap of 0.1% sulphur emissions, which can be achieved either by using LSFO or installing scrubbers on vessels. Being a more refined version of the bunker, LSFO commands premium rates and is also not as widely available, causing the demand-supply mismatch to exert inflationary pressure on bunker prices.
In this scenario, a cost-effective option is to install scrubbers on vessels, post which vessels can continue running on HFO, which is considerably cheaper than LSFO.
Given the widening spread between prices of HFO and VLSFO (USD 332/ tonne in Rotterdam and USD 538/ tonne in Singapore in June 2022), it makes economic sense to install scrubbers on vessels, so it can continue using HFO grade bunker.
While the average cost of installing a scrubber on new builds is approximately USD 2 million (retrofits on existing vessels are even more expensive), considering the prevailing LSFO premium, many shipping companies have opted to equip their vessels with scrubbers.
The ICS estimated that even assuming average scrubber installation costs of USD 5 million a vessel, the CAPEX would be recovered in 2 to 3 years (perhaps even earlier, if the premium continues to increase at its current rate).
As with most commodities, Bunker fuel too has a fairly evolved derivative market, where Carriers can hedge their bunker requirements and try to maintain stability in bunker expenses.
It is, however, not as frequently used in shipping as it is in other transportation industries (for example, it is estimated that Airlines hedge upto 60% of their bunker requirements).
Looking at the specific segments within the shipping industry, the limited levels of trading bunker derivatives is typically restricted to bigger shipping companies, with the medium and smaller-sized companies almost exclusively relying on the spot market.
Carriers set freight rates basis their cost base, which also includes bunker costs. While Carriers can estimate bunker price levels to some extent, given the extreme volatility in bunker prices on account of the multitude of variables involved, Carriers are unwillingly compelled to assume the risk of bunker prices rising more than anticipated, in which case their budgets and balance sheets will be negatively impacted.
It is to mitigate such risks and ensure minimal deviation to business plans/ revenue and profit projections that Carriers adopt hedging strategies to maintain a steady flow of bunker supplies at budgeted average prices.
Given the historical trend where oil/ bunker prices have been in contango, it is a very reasonable assumption that the bullish trend will continue in future as well, wherefore Carriers can reduce bunker spending and also exposure thereto by using bunker derivatives.
The slow but steady adoption of bunker derivatives has encouraged companies to launch future contracts, with one such example being the oil price reporting agency Argus, which launched a marine fuels future contract for Singapore, listed with the Chicago Mercantile Exchange.
As with most commodities, the prices of bunkers vary depending on the location. Globally, there are a few major bunkering locations, primarily catering to their geographical regions, where the majority of ships traversing the region bunker up. Prominent bunkering locations include Singapore, Rotterdam, Hong Kong, Fujairah, Panama, etc., each of which is a recognised centre of global/ regional maritime trade.
It, however, often happens that for geo-political and economic reasons, some countries offer bunkers at lower prices to induce vessels to call at their ports to fuel up. The intent is generally to utilise their vast reserves of natural gas and earn precious foreign exchange in the process.
An example was the Far East Asian ports of Russia, where the bunker was cheaper than at the major bunkering locations, prompting many Carriers – especially those that operated Intra Asia services – to add Russian ports to their service schedules and refuel at those ports. The difference in the bunker was, to an extent, so as to make it viable for the Carrier to incorporate Russian ports in their schedules – despite lower quantities of export and import cargo.
Since vessels are typically designed to run at a certain speed, the vessel’s engine is so constructed as to operate efficiently at this speed. Thus, the engine design is a constraint in implementing the policy of slow steaming and can thus reduce anticipated bunker savings (or partially negate the savings through higher engine maintenance costs).
Since slow steaming is now the norm in the industry, most new vessels being ordered are designed for sailing at slower speeds, which helps greatly in reducing bunker consumption.
Another facet is the design of the ship’s hull, where innovations include a streamlined structure and bulbous bows.
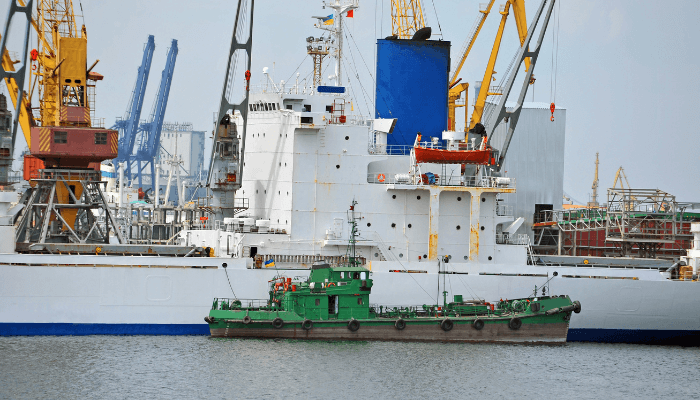

Given that almost all modern commercial vessels are connected through the internet, there is a mass of data available on all aspects of operation, including bunker consumption.
Prior to a voyage/ launching of service, the shipping company estimates its profit from the service by estimating costs (including bunker) and the expected revenue.
The cost estimates for bunker are derived basis the expected bunker consumption, which in turn is calculated basis the route, distance, weather conditions, vessels fuel efficiency, cargo weight, etc.
Since this calculation is a fairly straightforward one and is based on historical data (fuel consumption on previous voyages) and known facts (such as cargo weight and distance), deviations from the budgeted bunker consumption would only be on account of contingencies or unforeseen circumstances; otherwise, the bunker consumption ought to be within the estimated range.
Carriers should have in place a system of reporting and analysis to monitor actual bunker consumption as opposed to budgeted bunker requirements and investigate in detail where there are unexplainable deviations of significant magnitude.
Such reporting and analysis processes should also include comparing with internal records, benchmarking against historical consumption for vessels of similar class, and competitors’ average bunker expenses.
Such analysis will not only help in controlling bunker expenditure but will also serve as a reference for future calculations, and learnings therefrom can be used to streamline bunker consumption even further.
Monitoring bunker consumption against established benchmarks also increases the probability of frauds being prevented or detected well in time.
Since bunker is very expensive, people involved in the bunker supply and procurement process often find it extremely lucrative to indulge in various malpractices, as even a small fraction of the overall bunker procured can be valued at significant amounts.
It is for this reason that the probability of malpractices being perpetuated in the bunker procurement process is quite high, ranging from instances of pilferage to large-scale fraud.
Common malpractices include bunkers being adulterated or being off-specification, bunker suppliers under-delivering the quantity ordered or at times short-changing on quantity ordered in collusion with the crew.
These practices are fairly widespread across the industry, and Shipping Companies have over the years adopted various mechanisms to counter them. These mitigatory steps include testing the bunker for quality (to ensure that it is in accordance with the quality specified and that there has been no adulteration), supervising the bunker delivery and transfer process (while being cognisant of things like the Cappuccino effect), and finally ensuring that the company has in place robust and effective policies and codes of conduct governing employees, holistic mechanisms to monitor consumption and conduct bunker supply surveys.
You might also like to read:
Disclaimer: The authors’ views expressed in this article do not necessarily reflect the views of The Marine Learners. Data and charts, if used, in the article have been sourced from available information and have not been authenticated by any statutory authority. The author and The Marine Learners do not claim it to be accurate nor accept any responsibility for the same. The views constitute only the opinions and do not constitute any guidelines or recommendations on any course of action to be followed by the reader.
The article or images cannot be reproduced, copied, shared, or used in any form without the permission of the author and The Marine Learners.






We believe that knowledge is power, and we’re committed to empowering our readers with the information and resources they need to succeed in the merchant navy industry.
Whether you’re looking for advice on career planning, news and analysis, or just want to connect with other aspiring merchant navy applicants, The Marine Learners is the place to be.